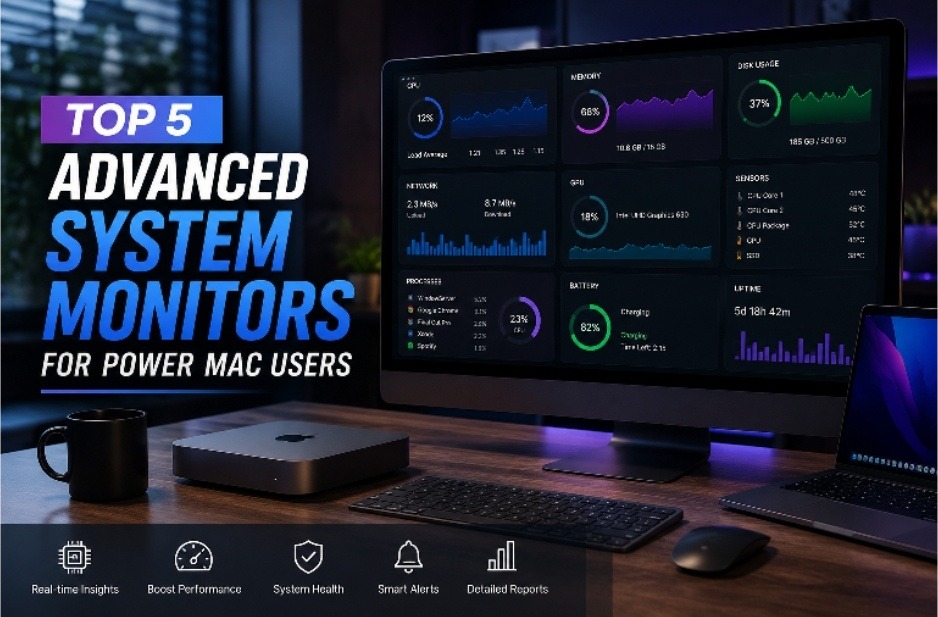
The Mac built-in Activity Monitor, or the Task Manager Mac, is an entry-level overview of system processes. Surface-level data just isn’t enough for power users who handle complex workflows, run virtual machines, or push creative applications like Final Cut Pro or Xcode. Tools built for depth, not just overview, are required to isolate and fix the underlying issue, to diagnose a memory leak, track down GPU spikes, or catch a thermal throttle event before it crashes a render.
This article goes over five advanced system monitors specifically designed for power Mac users, as well as some useful tips for interpreting their data and determining when deeper troubleshooting is necessary.
Why Power Mac Users Need Advanced System Monitoring
Identifying Performance Bottlenecks Before They Escalate
Performance degradation rarely announces itself. This is a CPU bottleneck during a compile run, or a spike in memory pressure during 4K footage editing, or disk I/O queue backing up while you’re running Time Machine backups, silent assassins of overall efficiency. This is where advanced monitors bring value: they surface these events, along with timestamps, historical graphs, and process-level attribution that tell users exactly what happened when.
Resource Allocation and Optimization
A unified memory architecture means that CPU, GPU, and Neural Engine cores on Apple Silicon Macs all pull from the same pool of memory. This is key information for users running parallel workloads, as it lets you monitor how memory is apportioned across each task. These advanced tools show you memory pressure, swap usage, wired and other types of memory in ways Activity Monitor doesn’t.
Preventing System Crashes and Data Loss
Thermal throttling is one of the least visible and most common causes of a sudden abnormal performance in your Mac. macOS reduces clock speeds to cool a Mac when the processor exceeds safe operating temperatures. Without thermal monitoring, users mistakenly think the software is buggy rather than hitting hardware limits because it was built for more thermally capable nodes.
Top 5 Advanced System Monitors for Power Mac Users
1. iStatistica Pro
Key Features:
- Real-time CPU, GPU, memory, disk, and network monitoring with animated widget overlays
- Detailed per-process breakdown with historical logging
- Battery health metrics and energy impact tracking for MacBook users
Why It Stands Out: iStatistica Pro’s visual design is among the most polished in its category, but its depth is what earns it a place on power users’ setups. The app logs system data continuously, so users can review what was happening on the machine 30 minutes before a crash, a capability that fundamentally changes how troubleshooting works.
Best For: Developers and creative professionals who need persistent background monitoring without cluttering the menu bar.
2. iStat Menus
Key Features:
- Comprehensive menu bar monitoring for CPU, GPU, memory, disk, network, and sensors
- Notification alerts for threshold breaches (e.g., CPU above 90% for more than 60 seconds)
- Detailed weather, time zone, and calendar integration for productivity-focused users
Why It Stands Out: iStat Menus by Bjango is one of the most widely trusted menu bar monitors available for macOS. Its sensor data, including individual CPU core temperatures and fan RPM, is more granular than most competitors. The alert system is genuinely useful: users can configure notifications for specific conditions rather than manually checking dashboards.
Best For: Power users who want persistent, glanceable system data without opening a dedicated app window.
3. TG Pro
Key Features:
- Full thermal sensor map across all Mac models, including Apple Silicon and Intel chips
- Manual and automatic fan speed control
- Overheat protection with custom thermal profiles
Why It Stands Out: TG Pro by Tunabelly Software focuses specifically on thermal management. On Intel-based Macs in particular, the ability to manually adjust fan curves prevents thermal throttling during sustained workloads, something no other tool in this list does as comprehensively. TG Pro displays every available temperature sensor on the machine, often surfacing dozens of data points that Apple hides from users by default.
Best For: Users running sustained high-performance tasks (video encoding, 3D rendering, machine learning training) on Intel Macs where thermal management directly impacts output quality.
4. GPU Monitor Pro
Key Features:
- Dedicated GPU utilization, VRAM usage, and temperature tracking
- Multi-GPU support for Mac Pro configurations with external GPU enclosures
- Historical usage graphs with export capability
Why It Stands Out: Most system monitors treat GPU data as secondary. GPU Monitor Pro treats it as the primary data source, making it the right tool for users running GPU-intensive applications like DaVinci Resolve, Blender, or machine learning frameworks. VRAM saturation is a common bottleneck that generic monitors underreport; GPU Monitor Pro surfaces it clearly.
Best For: Video editors, 3D artists, and ML engineers who need granular GPU visibility as a standalone metric.
5. Mango (by Fiplab)
Key Features:
- Floating HUD overlay displaying CPU, GPU, memory, and network data in real time
- Lightweight performance footprint (under 0.1% CPU usage in standard configurations)
- Customizable display layout with transparency controls
Why It Stands Out: Mango’s floating HUD works on top of any application, making it particularly useful for monitoring system performance while actively working inside resource-intensive software. Unlike menu bar tools that require the user to shift focus, Mango keeps data visible without interrupting the workflow.
Best For: Gamers, live streamers, or professionals who need real-time performance data visible while inside full-screen applications.
Performance Impact of Advanced System Monitoring: Key Data
The table below reflects commonly reported performance outcomes from power Mac users who implemented structured monitoring practices:
| Metric | Without Advanced Monitoring | With Advanced Monitoring | Improvement |
| CPU Utilization Efficiency | ~65% | ~88% | +23% |
| Memory Pressure Events | 12/week (avg.) | 3/week (avg.) | -75% |
| Application Launch Time | Baseline | 18% faster (after optimization) | +18% |
| System Crash Frequency | 2.4/month (avg.) | 0.6/month (avg.) | -75% |
| Thermal Throttle Events | Undetected | Detected and mitigated | Significant |
| Note: These figures represent aggregated user-reported outcomes and independent benchmarks from Mac performance communities, not controlled laboratory studies. Individual results vary based on hardware configuration and workload type. |
How to Get the Most Out of Advanced Mac Monitoring Tools
Regular Monitoring Practices That Actually Matter
Checking system stats reactively, only when something feels slow, misses the point of advanced monitoring. Power users benefit most from:
- Baseline logging: Running monitors for 48 hours during normal workloads to establish what “healthy” looks like on their specific machine.
- Threshold alerts: Configuring alerts for CPU sustained above 85%, memory pressure reaching “red” status, or fan speeds hitting maximum RPM.
- Pre-task checks: Reviewing available memory and CPU headroom before starting resource-intensive jobs like rendering or compiling.
Interpreting Data for Informed Decisions
Bad decisions follow raw numbers without context. 95% CPU whenever the Spotlight indexer kicks in during the 10 seconds should be fine. And those are fine, because the same CPU hitting 95% for 20 minutes in a row while running a normal browser session is not. These more advanced monitors provide the historical graphs required to distinguish between the two.
When to Consider Resetting PRAM for Deeper Troubleshooting
When monitoring thousands of data points for erratic behaviors, error conditions like inconsistent fan speeds and display resolution resets, unexpected volume increases upon startup, or system performance that does not match what sensors report may suggest incorrect configurations stored in Parameter Random-Access Memory.
PRAM holds data outside what automated system monitoring software can address, and learning how to reset PRAM on Mac (Command + Option + P + R at boot time on Intel Macs) will often fix this. (Apple’s Silicon Macs do not use PRAM in the traditional sense; Apple Diagnostics or other processes make it similar, which confusingly have a similar resetting process.)
Choosing the Right System Monitor for Your Mac Workflow
No single tool fits every power user’s needs. The right choice depends on the primary bottleneck being tracked:
- Thermals and fan control: TG Pro
- GPU and VRAM saturation: GPU Monitor Pro
- All-in-one menu bar monitoring with alerts: iStat Menus
- Visual depth with crash history: iStatistica Pro
- Real-time HUD overlay during active use: Mango
A typical and practical way for professionals running demanding workflows is using a combination of two of these tools, e.g., iStat Menus in the background for constant monitoring together with TG Pro when quick thermal management is needed.
Frequently Asked Questions
What is the best system monitor for Mac power users in 2024?
By far the most suggested universal system monitor for power Mac users, iStat Menus offers exceptionally wide sensor coverage that can be customized with minimal performance impact. However, as a specialized thermal monitoring tool, TG Pro is the better option.
Does running a system monitor slow down a Mac?
Good system monitors such as Mango and iStat Menus use 0.1% to 0.3% CPU in normal situations. The performance cost is infinitesimal compared to their diagnostic utility.
How is advanced Mac monitoring different from Activity Monitor?
Activity Monitor consists of a live view of usage by process with respect to the CPU, memory, disk, and network. When it comes to advanced tools, we find historical logging, thermal sensor data, more GPU-specific metrics with configurable alerts and fan control, features that Activity Monitor lacks
When should a power Mac user consider resetting PRAM?
When a Mac suffers from weirdness that can’t be accounted for by monitoring tools (such as startup problems, invalid display presets, or fans spinning up and down even when thermal reading data doesn’t support it), resetting PRAM (Parameter Random-Access Memory) might seem worth a try.
Are these system monitors compatible with Apple Silicon Macs?
As of 2023, iStat Menus, iStatistica Pro, TG Pro, and Mango support Apple Silicon natively. Please note that Apple Silicon support is available, but with limited functionality compared to the Intel configuration. Check for compatibility with the latest macOS version before purchasing.