


Infographics effectively convey complex information in concise and engaging formats, leveraging a combination of words, numbers, symbols, colors, and images to tell a story and drive home a key message. Kelly et al argue that by presenting information in a visually appealing way, infographics capture viewers’ attention and make it easy to grasp the essence of the message at a glance. This is vital in today’s digital age, where people often scan content quickly and rarely read lengthy texts, such as multi-page press statements.
Compared to various Ministries, Departments, and Agencies (MDAs) that make up the government of Uganda, infographics have become more popular in the private sector both in print and digital landscapes. They are used by Public Relations professionals as a strategic tool for engaging their target audiences. According to Gina Brennan, when creating infographics, it is important to use text sparingly to highlight essential points, avoiding clutter and unnecessary details. They should not contain lengthy paragraphs and should be easily digestible, enabling readers to quickly grasp the key takeaways.
While infographic design requires technical know-how and a high level of creativity, various tools have emerged that assist users in quickly generating visually appealing content simply by drag and drop. A good example is www.canva.com which provides a wide range of templates both for still and motion graphics. It enables one to select and customize a template suitable for the nature of the information. Unlike conventional tools that require sophisticated training to use such as Adobe (Photoshop, Illustrator, After Effects among others), these digital tools make work quicker with less effort, minimal training, and basic computer literacy. This is in addition to their ability to produce a variety of options for multimedia content such as videos, animated GIFs, still graphics, and audio-visual graphics.
Other common digital platforms for creating infographics include Visme.co, Venngage, Piktochart, Visualize.me among others.
The Uganda Access to Information Act 2005 establishes the right of individuals to access public information held by public institutions. This is in line with Article 41 of the Ugandan Constitution. It ensures transparency, accountability, and citizen participation in governance by granting access to government documents and records.
There has been consistent use of plain text documents in the dissemination of official government communication. Only a few instances are noticeable where text is combined with images and or videos, icons, and vectors to transform the intended messages into compelling formats. The world has moved away from such. According to a report by Microsoft as of May 2015, the attention span had reduced to the average of eight seconds for adults.
According to Jakob, research shows that users will read about 20 percent of the text on a single page. Owing to the short attention span in addition to the predominant text format of information shared by most government MDAs in Uganda, very few people can either pick the interest or grasp the content of the message. This leaves a big information gap in the general population and creates room for speculation and misinformation because the intended message is most of the time distorted.
Consequently, the uptake of government programs and services remains low which greatly impacts socio-economic transformation. The adoption of infographic content is therefore inevitable in enhancing government communication to reach a wider audience in the country thereby enhancing awareness of government programmes and services.
It is therefore prudent that the government becomes deliberate in ensuring citizens understand and make good use of public information by investing in creative ways and adopting the latest techniques in the dynamic world we face today.
While infographics can be a game changer in PR and communication, their production is time-consuming and requires a high level of computer literacy and dedicated training. Additionally, they involve shortening of messages to fit the purpose of compelling visuals with less text. This way, important information can easily be lost which might render such infographics useless or half-baked. It therefore takes a keen eye and creativity to produce compelling infographics that are informative at the same time. To counter this for effectiveness and efficiency, the government of Uganda through the Ministry of ICT and National Guidance should enhance the capacity of PR and Communication departments. The solution to this challenge is two-fold:
Partnering with other government agencies specializing in graphic design and content production; Building the capacity of existing Communication and PR officers and amending their KPIs to include graphic designing.
Most communication officers and PR practitioners employed by the government of Uganda are computer literate and therefore require minimal training to adopt basic tools for generating compelling infographics from respective information and content pieces.
A publication in Extension Journal reveals that a rising trend in the use of infographics has emerged in a variety of content areas. Infographics can deliver meaningful messages. In his article published on www.nation.africa, Sam Wambugu argues that the best infographics are clear, easy to digest, and eye-catching. The beauty of infographics is their ability to convey a message, concept, or instruction in a very short amount of time. We are all inclined to process visuals more easily than a piece of text and that is why infographics appeal to so many people.
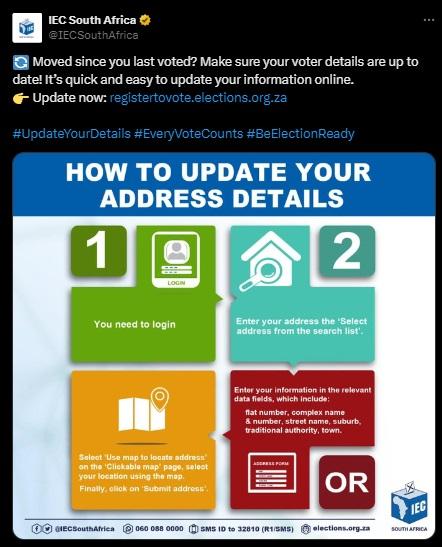
The Electoral Commission of South Africa is one good example of a government agency in Africa that has leveraged infographics to educate the masses. The content on their X page at a glance is eye-catching, informative, and legible enough that one would easily be forced to pay enough attention to it. Because of this, most of their content shared on their X channel has attracted high engagement rates. This is an indication that infographic content attracts more engagement and should therefore be adopted by the Government of Uganda to engage more of its citizens.
Most businesses in the private sector have learned the power of telling a story using infographics, the visual representation of data. One may wonder: how effective are infographics as a tool for enhancing government communication?
The persistent use of infographics will increase the exposure of such content which will in turn shift the perceptions of citizens on government programmes and services thereby increasing their uptake. For example, one could use an animated video on how to renew their driver’s license or the steps of getting government funding through the Parish Development Model.
Communication and PR experts in government MDAs can use infographics to create compelling messages to nudge citizens in beneficial directions without restricting their freedom. Presenting information better and more clearly helps the public to make desirable decisions from an informed point of view.
According to Thaler and Sunstein, by understanding human behavior and decision-making patterns, we can create environments that facilitate better choices for individuals, nudging people toward decisions that benefit themselves and their communities. In April 2024, city traders in Kampala, Uganda closed shops in their protest against tax regulations under the Electronic Fiscal Receipting and Invoicing Solution (EFRIS). Uganda Revenue Authority (URA) used infographics in its PR strategy to simplify the complex information about the system and was able to nudge traders into understanding and adopting the system which previously had been perceived to be forced on them.

The government of Uganda can prioritize and emphasize key messages —keeping in mind that publics pay more attention to less text and more visuals. Their consistent use of infographics also enhances their brand visibility over time. This creates a distinction between the information they send out and any other information that might be created by propagandists and unscrupulous characters that aim to spread disinformation. This is noticeable in the way Agora Discourse uses infographics to emphasize its messaging and gain popularity. Agora Discourse is a Digital Public Square Promoting Human rights, Public Accountability, and Social justice. It has been consistent in calling out politicians and public officers allegedly involved in corruption and embezzlement scandals, a discussion that has attracted different Ugandans from all corners to unite against the vice.
Brands that use infographic messages can nudge and therefore engage a wider audience. Consequently, their audience grows faster compared to those who do not use infographics. This can greatly influence perceptions because the publics are constantly informed.
Infographics are influential in shaping narratives. They are best suited to frame slogans, jargon, and catchphrases which help to make targeted messages more memorable and relatable. They have emerged as a powerful tool for effective communication, leveraging visual storytelling to convey complex information in concise and engaging formats.
While the private sector has embraced infographics, the government of Uganda has not done enough to harness their potential. By adopting infographics, MDAs can enhance citizen engagement, increase awareness of programs and services, and promote transparency and accountability.